Devops team warned us,
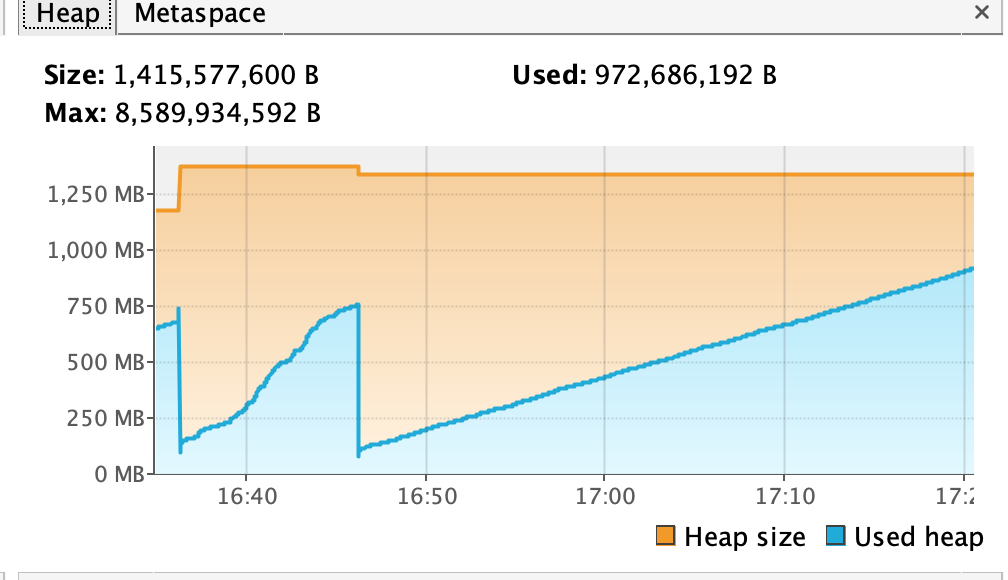
Project ABC consumes too much memory. We suspect that your change on 7 july caused a memory leak, please solve it.
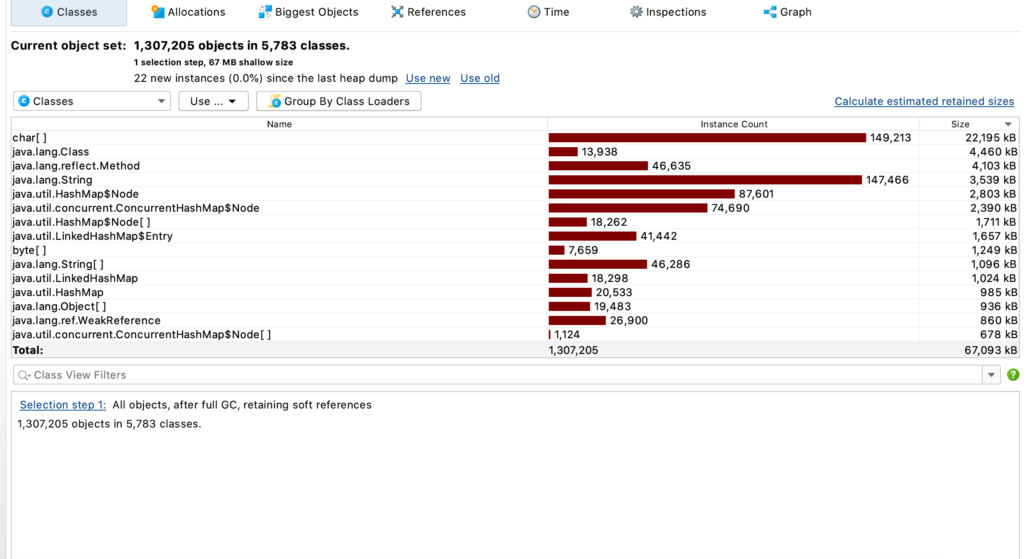
On local executions, I have encountered a memory problem that was little bit strange because during jprofiler analysis and when controlling the latest branches, I only saw spring boot beans and our temp local data which should be deleted during garbage collection process.

After more investigation, i noticed that it is increasing really fast which is also caused by our projects nature, lots of scheduler’s, too many request response objects, too many god classes, lots of integrations etc…. typical heavily coded legacy project.

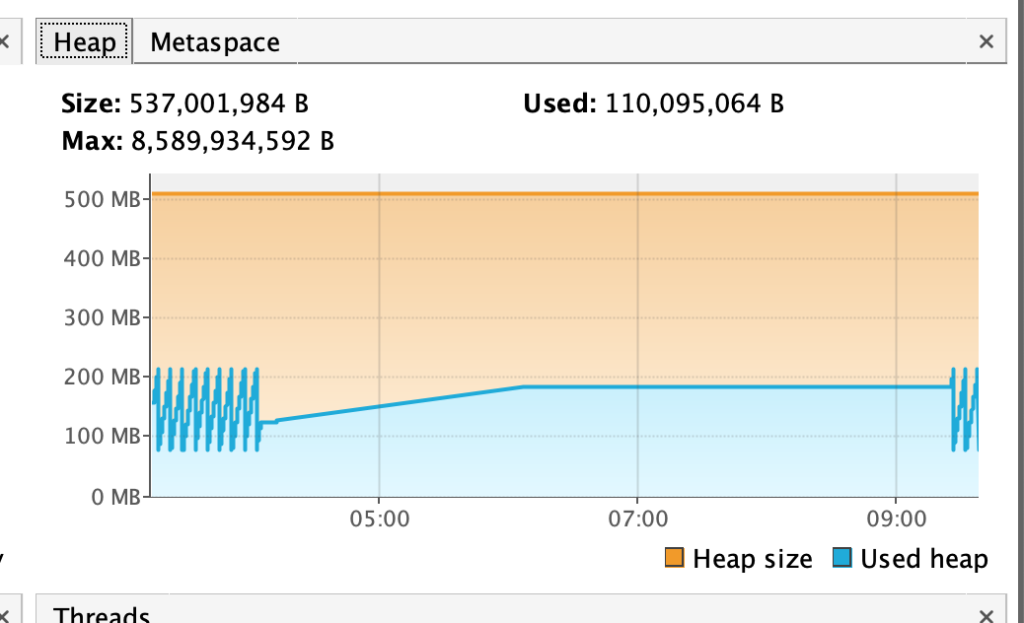
After exhausting investigation of last week’s memory consumption increase, problem was related to latest vendors integration that has response contains japanese special characters. Instead of refactoring code (that is not so much necessarily) with just changing garbage collection strategy (of course after reading 4-5 hours to find the correct strategy like risking ‘stop the world problem’ or using cpu very carefully and testing various strategies) and test it extensively with using this strategy -XX:+UseParNewGC our system work very well with our exhausting JMeter tests under 110 mb memory in 6:30 hours.

Ps : Although our latest integration speed up the memory increase problem, issue is resolved sliently after devops team remembered that they forget to add our jvm parameters during deployment.
Well done Can